Introduction
During my master degree studying, I only worked on medicial images. Therefore, I only had 3D medicial images in my mind, when I heard people talking about 3D pictures. By researching for mechanical engineering department, I learned about the topics of 3D Data actually is much more complex than I thought, and it is not accurance to call all of them “3D photos”. Therefore, it is necessary for me to review and try to have a better understand of this topic: What is 3D Data?
Represent 3D Data
Before check what kind of file formats for 3D images, let’s talk about how many different ways can be used to describe a 3D image. 3D Representations are languages for describing geometry in Semantics (such as values and operations) and Syntax (data structures and algorithms)
Today, there are many different ways to represent 3D data for different purpose and devices. Such as voxels(which is for medicial images), RGB-D, 3D point clouds(can be employed for self-driving technology), depth-maps, parametric models, multi-view images. It is interesting to have a brief understing for all of them. We can put them in some groups
| Raw data | Solids | Surfaces | High-leevl structures |
|---|---|---|---|
| point cloud | Voxels | Mesh | Scene graph |
| Range image | BSP tree | Subdivision | Skeleton |
| Polygon soup | CSG | Parametric | Application specific |
| Sweep | Implicit |
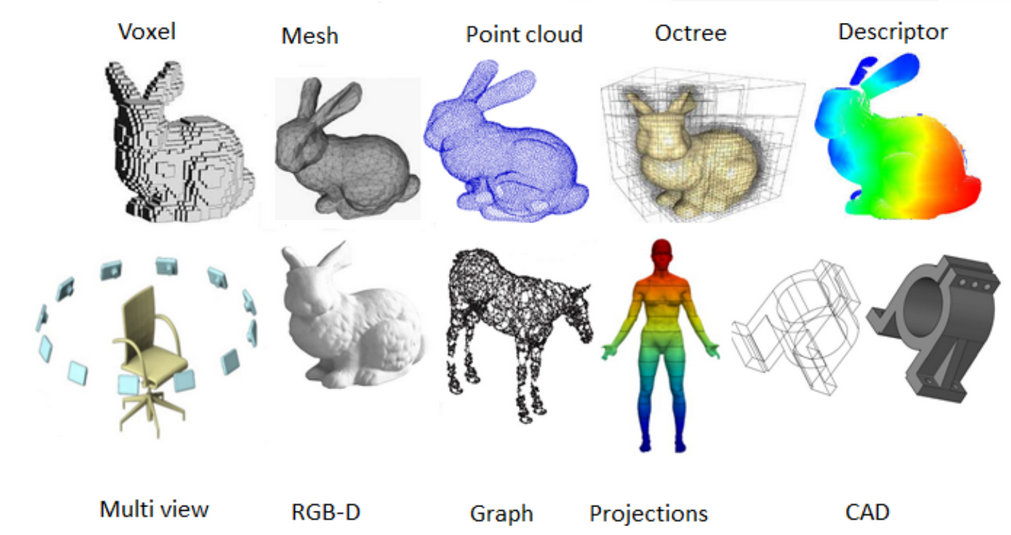
Some Examples of 3D Representations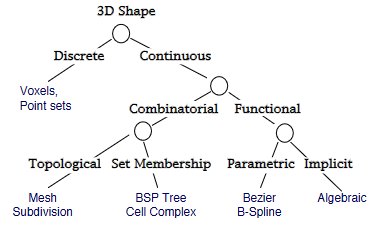
Taxonomy of 3D Representation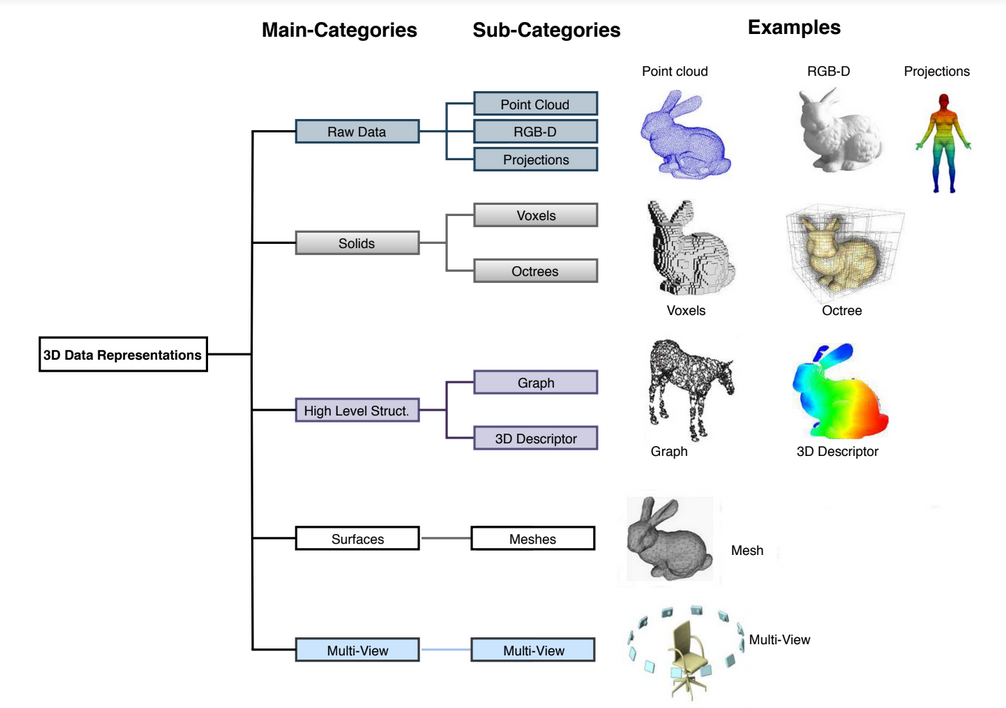
Another Taxonomy of 3D Representation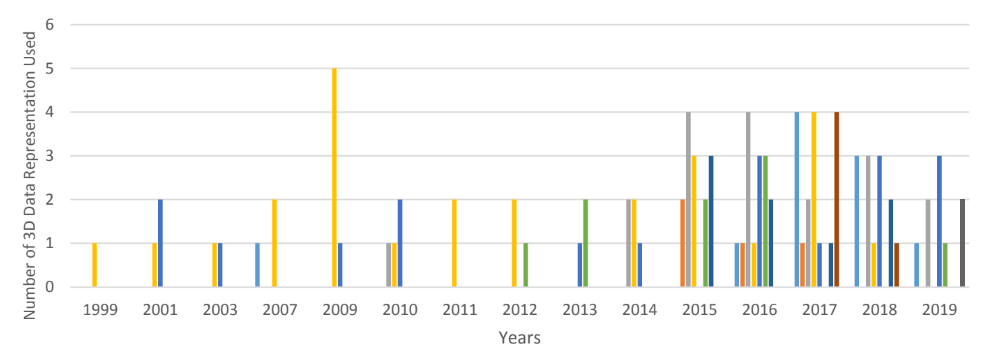
Porgress of 3D Data Representation Along with Time
Voxels
Voxels are one kind of 3D solid models. It has uniform grid of volumetric samples. Each voxel is a tiny cube storing data. It is popular for medical images and engineering images.
Different from voxels, Shell only has surface. In other word, it shows the boundary. This one is popular for making games, films, or reality capture workflows.
Octrees
Octrees is another popular solid 3D data representation. OctNet is one application from Octrees. The idea of Octrees is an extension of a 2D quadtree. The individual node in an octree contains eight children. Octree is simply a fluctuating sized voxel and it is considered one of the most scattered oxel representations which was recently used in conjunction with CNN for 3D shape analysis task. It has the advantages of efficient memory utilization and can be used for generating high resolution voxels. However, it has a major drawback which is caused by its inability to maintain the geometry of some 3D objects like the smoothness of the surface.
Range Image
It is a set of 3D points mapping to pixels of depth image.
Polygon Soup
It is an unstructured set of polygons.
3D Mesh
It is connected set of polygons (usually triangles). Mesh may not be closed.
3D meshes consist of a combination of vertices, edges and faces that are mostly used in computer graphics application for storing 3D objects and for rendering purpose. The vertices contain connectivity list that describes how each vertices are connected to one another. The major challenges of mesh
data are, they are irregular and very complex, which makes them not usually used in deep learning methods until recently when propose MeshNet which can to deal with the complexity and irregularity problems of mesh data and successfully performed 3D shape classification and retrieval task on Model 10 dataset. Also used the edges of the mesh to perform pooling and convolution on the mesh edges by taking advantages of their intrinsic geodesic connections.The major limitation of mesh data are its complexity and irregularity which makes it less usable in the research community.
Subdivision Surface
Coarse mesh and subdivision rule. It defines smooth surface as limit of sequence of refinements.
Parametric Surface
Tensor product spline patchs. Careful constraines to maintain continuity.
Implicit Surface
BSP Tree
Stand for Binary space partition with solid cells labeled. It constructed from polygonal representations.
CSG
CSG has a hierarchy of boolean set operations (union, difference, intersect) applied to simple shapes.
Sweep
Solid swept by curve along trajectory.
RGB-D
It is a kind of Raw Data. Microsoft Kinect can be used to characterize RGB-D images. It gives a 2.5D data about the obtained 3D object by giving the depth map(D) together with color information(RGB). Many RGB-D dataset proved to be effective in pose regression, correspondence, and character recognition.
3D Point Clouds
Knows as PCD(Point Clouds Data), unstructured set of 3D point samples. It is one kind of Raw Data. This data is a lots of points’ information such the points’ location in 3D coordinates with a Cartesian or other coordinate systems. In these images, all of the objects only has envelope or surface. It can be collected by (structured lights scanning,) photogrammetry(Gerpho), LiDAR, or depth sensing. Some Deep Learning projects are using it as dataset.
Point Data has been applied in classification, segmentation, object recognition, reconstruction, and other Machine Vision topics.
- Main Operations:
- Transformations: You can multiply the points in the point list with linear transformation matrices.
- Combinations: “Objects” can be combined by merging points list together.
- Rendering: Projects and draws the points onto an image plane
- Main Benefits:
- Fast rendering
- Exact representation
- Fast transformations
- Main Disadvantages:
- Numerous points (obj. curve, exact representation)
- High memory consumption
- Limited combination operations
3D Projections
It is a kind of Raw Data. 3D projections are a way of mapping 3D points to 2D planes.
Depth-Maps
Parametric Models
Multi-View Images
To render a set of images from verities of views and takes the pile image and use as an input to CNN which can be used for shape analysis tasks. The key benefits of these approaches are that they can handle high-resolution inputs as well as utilizing the full image-based CNNs for 3D shape analysis tasks. However, determining the number of views and self-occlusions are major draw-backs of these methods which can lead to huge computational cost if the numbers of views are large.
Scene Graph
Union of objects at leaf nodes.
Performed a 3D object retrieval based upon a graph-based object representation which is composed of new mesh segmentation along with a graph matching between graph of the query and each of the graph that corresponds to the object of the 3D objects database.
Skeleton
Graph of curves with radii.
Computational Differences
- Efficiency
- Combinatorial complexity (e.g. O( n log n ) )
- Space/time trade-offs (e.g. z-buffer)
- Numerical accuracy/stability (degree of polynomial)
- Simplicity
- Ease of acquisition
- Hardware acceleration
- Software creation and maintenance
- Usability
- Designer interface vs. computational engine
References
- How to represent 3D Data?, Florent Poux, Ph.D., https://towardsdatascience.com/how-to-represent-3d-data-66a0f6376afb
- Overview of 3D Object Representations, Adam Finkelstein, https://www.cs.princeton.edu/courses/archive/spr05/cos426/lectures/12-reps.pdf
- A Review on Deep Learning Approaches for 3D Data Representations in Retrieval and Classifications, Abubakar Gezawa, Yan Zhang, Qicong Wang, Lei Yunqi, https://www.researchgate.net/publication/340074064_A_Review_on_Deep_Learning_Approaches_for_3D_Data_Representations_in_Retrieval_and_Classifications
If you have any questions, please contact with tianluwu@gmail.com